Confidence intervals explained, with an R simulation
statistics
confidence-intervals
estimation
What a 95% confidence interval really means — demonstrated by simulating repeated samples in R — plus how to compute intervals for a mean and a proportion.
Author
Rverse Analytics
Published
June 12, 2026
A confidence interval says more than a p-value: it shows the range of plausible values and how precisely you’ve estimated them. But the “95%” is almost always misread. Let’s fix that with a simulation. (Just need an interval? Use our confidence interval calculator.)
What 95% actually means
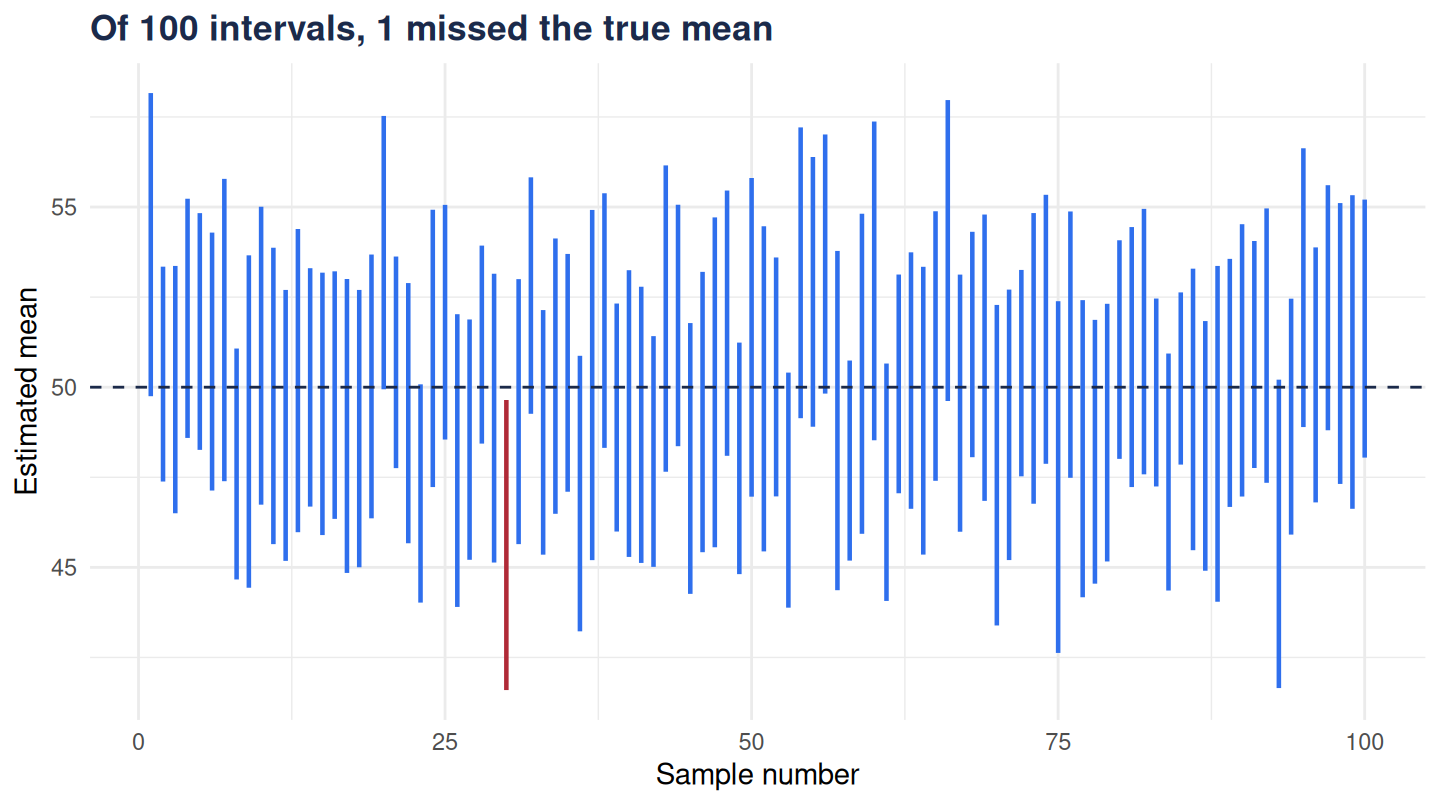
A 95% CI is built by a procedure that, across many repeated samples, produces intervals capturing the true value 95% of the time. It is not a 95% probability that the truth lies in this particular interval — once computed, the interval either contains the true value or it doesn’t.
Watch it work
Draw 100 samples from a population with a known mean of 50, build a 95% CI from each, and colour the ones that miss: